Introducing ‘Alteryx’ as a platform for Data Science
Alteryx: the Data Scientist’s multi-tool?
What is Alteryx, and why should I care?
This guest blog entry was inspired by Richard’s recent post in which he observed that “it is always important to keep an eye on the tools we use as data scientists and forever be on the lookout for new and better ways of doing things.” Just as Python is a superb ‘Swiss Army Knife’ for working with data, so Alteryx is proving to be an essential multi-tool for data scientists. In this post I want to show why.
You may have heard of Alteryx already: it was recently named a Leader in Gartner’s 2018 Magic Quadrant for Data Science and Machine-Learning Platforms, and it picked up a Gold Award in Gartner’s 2017 ‘BI and Analytics Platforms’ Customer Choice Awards, ahead of Tableau, Microsoft and Qlik.
In a nutshell, Alteryx offers repeatable, code-free drag-and-drop analytics. It’s powerful and quick, easy to learn and use, and has been adopted by prominent brands such as Vodafone, Dell, Tesco, Deloitte, Mastercard and Experian, to name but a few. Alteryx doesn’t come cheap, but it can be a worthwhile investment for organisations who want to save time and deliver at scale.
Show me an example
In this post I’m going to look at Alteryx’s spatial analytics capabilities, while the next post will explore its tabular data manipulation tools. The example here, inspired by a recent trip to my local Post Office, demonstrates how Alteryx can provide answers in minutes instead of hours or even days.
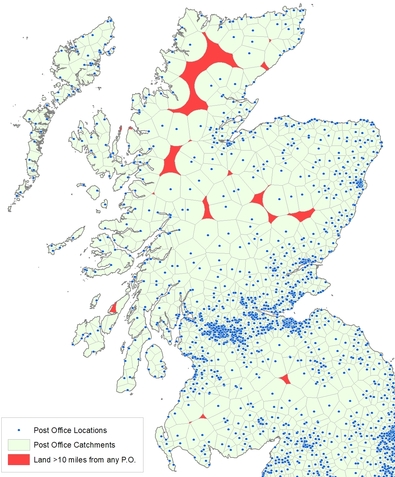
Living in Edinburgh, I’m lucky to have several Post Offices within a short walk. But some parts of the country aren’t so fortunate, and I wanted to explore where and why. I found some open data on Post Office Branch Locations from Datadaptive, and loaded the CSV file in Alteryx.
Here are my results: red areas are places more than 10 miles (as the crow flies) from a Post Office. Not surprisingly, these are remote, mostly upland locations where the population density is low and, presumably, the need for Post Offices is small. What might surprise you, however, is how easy it was to obtain these results.

How did you do that?
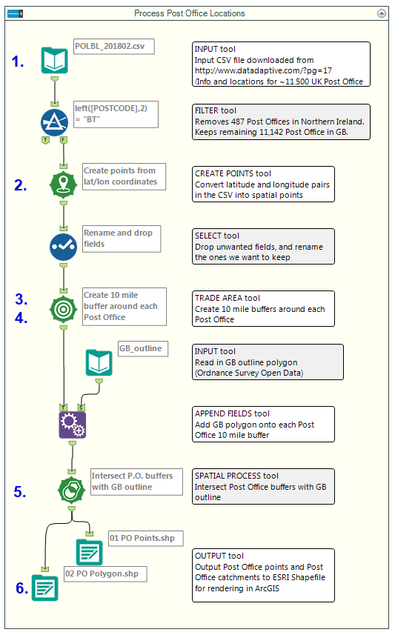
My workflow is pictured below. Think of Alteryx workflows or modules as data processing recipes: you drag configurable tools onto a canvas, connect them together, and then hit ‘Run’ to watch the action unfurl. Just as Apple will tell you “there’s an App for that”, so Alteryx users will more often than not point out that “there’s already a tool for that”. No more complicated workarounds or reinventing the wheel (although you can build macros or custom tools in R should you need to).
This workflow takes 10 seconds to run, and can be edited and repeated again and again.

The six blue numbers on the workflow above correspond with the six intermediate processing stages shown in the graphic below, described in more detail underneath (along with links to Alteryx’s help files so you can learn more about each tool’s configuration options):

- Import all fields in the CSV file (INPUT, FILTER, SELECT)
- Use the LAT and LON fields to create spatial points (geometry) from coordinates (CREATE POINTS)
- Draw a 10 mile buffer around each Post Office point (11,142 in total)… (TRADE AREA)
- …and merge overlapping buffers to create a single catchment per Post Office
- Clip catchments to the GB outline polygon (APPEND FIELDS, SPATIAL PROCESS)
- Intersect results again to identify (in red) land > 10 miles from nearest P.O. (OUTPUT)
Can I reuse the workflow for something else?
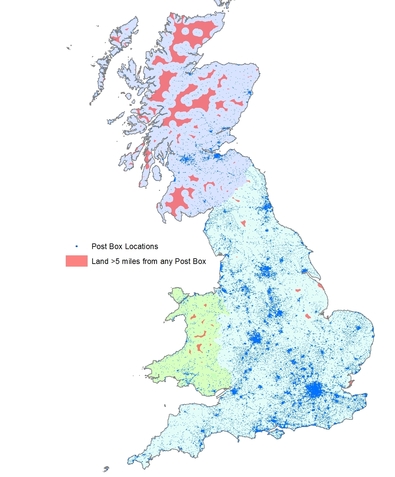
Absolutely! Alteryx workflows are easy to tweak, reuse and share. It took me less than 5 minutes to adapt the analysis above for Post Boxes (extracted from OpenStreetMap) instead of Post Offices.

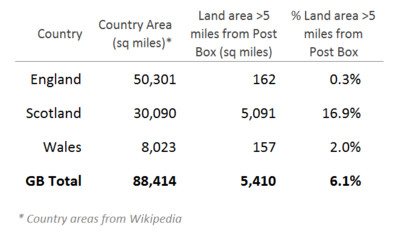
This time I used a 5 mile radius to identify areas > 5 miles from the nearest Post Box. I then combined that with GB country polygons to produce the following area breakdown:

I was surprised to see that 17% of the land area of Scotland is over 5 miles from the nearest Post Box, whereas in England the total is 0.3%. I’m not suggesting this is good or bad, but it’s intriguing to me as a geographer-turned-data scientist, and in any event it’s a nice way to demonstrate how rapidly Alteryx can turn raw data into (potentially!) useful insight. If I can do this in a few minutes with some sample data, imagine what you could achieve in a few weeks with your own data!
Surely straight line distances aren’t very useful
It’s true that Euclidean straight line distances don’t tell you much about transport, terrain, or other landscape features. You could live 50 meters from a Post Box, but if there’s an uncrossable wall, motorway or river in the way then you could face a lengthy detour. A more realistic analysis might use walking or driving time based on road and transport network data, and it won’t surprise you to read that there’s already a tool for that: the Trade Area Tool uses the Guzzler drivetime engine to define travel times or isochrones.
Where can I learn more about Alteryx?
Watch this space for a follow-up post on Alteryx’s extensive tabular data functionality. Readers based in Scotland should also consider attending the following free breakfast event on 21st March 2018: https://www.datafest.global/events-feed/2018/3/21/data-driven-insight-in-higher-education
For a free trial, visit www.alteryx.com.
John Tullis - Postgraduate Admissions Officer at The University of Edinburgh